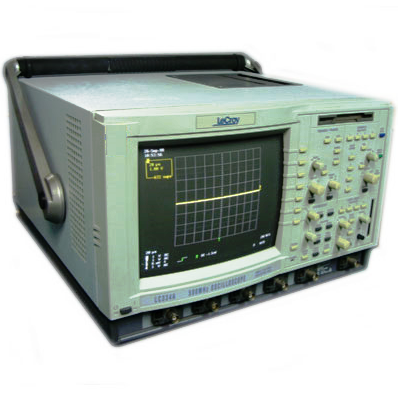
LeCroy LC534L 4 channel 1 GHz Digital Oscilloscope 2 GSa/s
The LeCroy LC534L oscilloscope is a graph-displaying device - it draws a graph of an electrical signal. In most applications, the graph shows how signals change over time: the vertical (Y) axis represents voltage and the horizontal (X) axis represents time. The intensity or brightness of the display is sometimes called the Z axis.

The LeCroy LC534L oscilloscope's simple graph can tell you many things about a signal, such as: the time and voltage values of a signal, the frequency of an oscillating signal, the “moving parts“ of a circuit represented by the signal, the frequency with which a particular portion of the signal is occurring relative to, other portions, whether or not a malfunctioning component is distorting the signal, how much of a signal is direct current (DC) or alternating current (AC) and how much of the signal is noise and whether the noise is changing with time.

)
)
)
)
)
)
)
)
)
)
)
)
)
)
)
)
)
)
)
)